USAAAO — 2026 First Round
Question 22
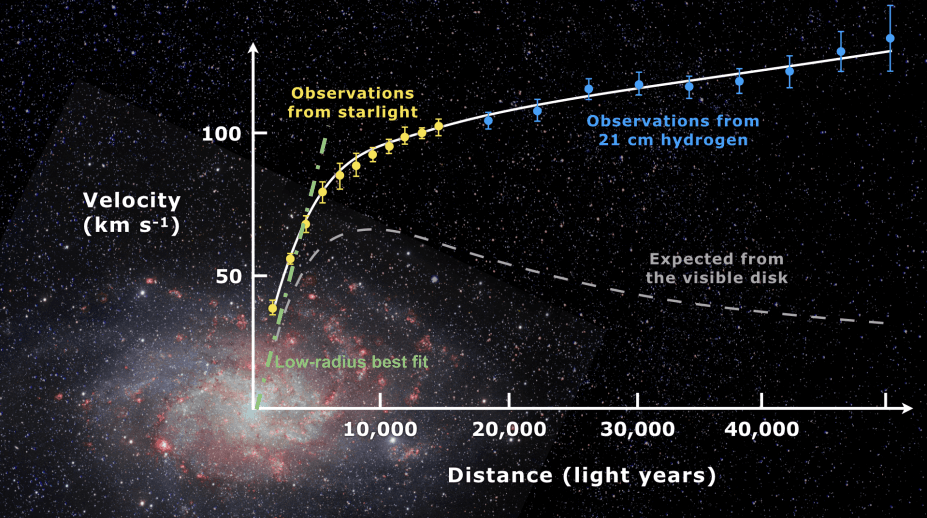
Consider the following graph (below), which shows the mean orbital velocity of stars around a galaxy’s center as a function of distance from the center. The graph also shows the expected orbital velocities (dashed line) from observations of visible matter. The discrepancy between the observed and expected values is assumed to be due to invisible dark matter. Now, for larger values of r, the discrepancy between the observed and expected rotation curves begins to appear more significant. Assume that the expected rotation curve (dashed gray curve) is calculated off the distribution of all baryonic (“standard”) matter, while the observed rotation curve (solid white) is due to the combination of baryonic matter and dark matter. Within a radius of r = 40,000 ly from the galactic center, and according to the graph, which of the following is closest to the ratio between the dark matter mass and the baryonic matter mass enclosed?
Sign in to save your progress.
Source
USAAAO 2026 First Round, Question 22. Question text, choices, and answer were transcribed from the official USAAAO exam and solutions PDFs. Official rotation curve omitted; consult cited exam page.